
-
add to favourites


The threat curve
Thursday, August 6, 2020
We love statistics. It's an exact science. But only if one understands which figures they need to compare. Want an example?
Everyone has been talking about the coronavirus lately and how the number of fraud schemes and attacks involving people working remotely have increased. And when we see a headline screaming about another upsurge in cybercrime in 2020, what should we think? That's right, here is yet another confirmation of numerous news stories about the rise in criminal activity from March to June.
In the first quarter of 2020, the number of cybercrimes grew by 83.9%. This upsurge is what is mainly contributing to the 4% crime rate increase nationwide.
To understand these figures, bear in mind that previously the annual cybercrime growth rate was roughly 70%.
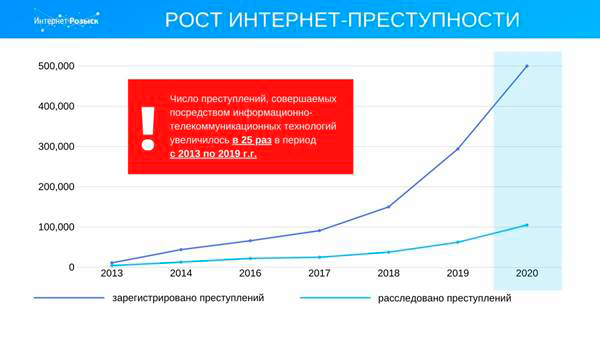
The charts clearly show that cybercrime has been increasing at a growing rate since 2013. Moreover, the acceleration was more or less linear until 2017. But then the curve started turning upwards. And the first quarter of 2020 showed no upsurge outside that trend.
Unfortunately, the graph doesn't show the increase by the type of crime, and there is no way we can understand how different types of criminal activity are contributing to the overall increase. But we can only discuss cybercrime statistics.
In April, Doctor Web’s virus laboratory registered 34.27% more requests than in March to decrypt files compromised by ransomware trojans.
In June, Doctor Web’s virus laboratory registered 6.55% fewer requests than in May to recover files compromised by ransomware trojans.
There is an increase for sure, but you need to factor in something else.
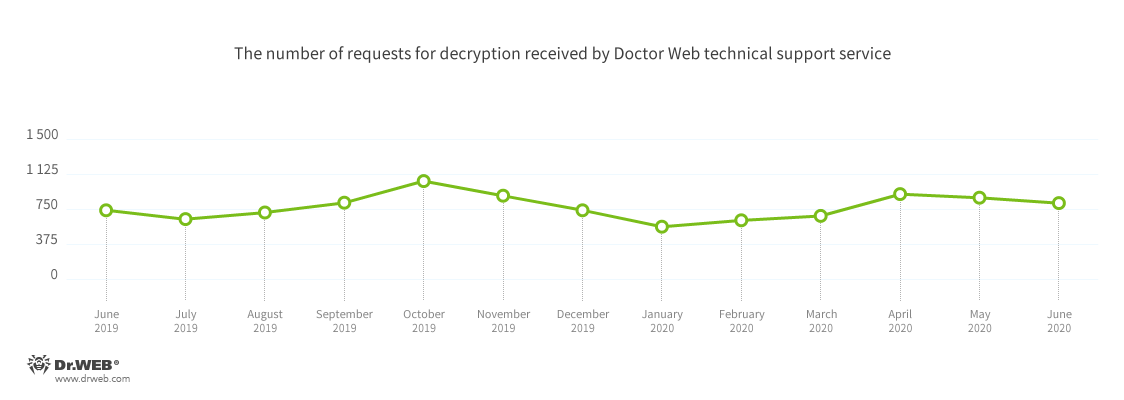
The increase in decryption requests happened after a decline. And this is a regular pattern.
And one more thing.
The June analysis of Dr.Web’s statistics revealed a 113.21% increase in the total number of threats compared to the previous month. The number of unique threats dropped by 24.1%.
The total number of samples detected is much bigger than the number of new and unique threats. That means that threat actors did step up their attacks, but the same trojans were just being used more often. Which correlates with an increase in the number of malicious sites.
| May 2020 | June 2020 | Growth |
|---|---|---|
| + 107 082 | + 122 679 | + 14.56% |
The Anti-virus Times recommends
Don't forget that Doctor Web's malware activity reviews are published monthly. They include the latest statistics as well as information about the number of identified threats. The figures show that cybercrime is constantly growing and that only the fraud schemes and attack vectors being used by criminals are changing.
Do you read our reviews? Subscribe here to receive notifications about our latest publications. New subscribers also get a nice bonus—20 Dr.Webling award points. News digests are released once a week. By the way, we are coming up with a new design for our digest, and it will be available soon 😊
![[Twitter]](http://st.drweb.com/static/new-www/social/no_radius/twitter.png "Shared 0 times")
Tell us what you think
To leave a comment, you need to log in under your Doctor Web site account. If you don't have an account yet, you can create one.
Comments
Niuxin
03:39:31 2020-08-15
Шалтай Александр Болтай
21:22:55 2020-08-06
Masha
21:17:10 2020-08-06
Татьяна
20:54:05 2020-08-06
Toma
20:42:39 2020-08-06
Dmur
17:46:45 2020-08-06
Lia00
16:31:35 2020-08-06
EvgenyZ
13:44:14 2020-08-06
Неуёмный Обыватель
09:31:33 2020-08-06
GREEN
08:55:57 2020-08-06
This fight against viruses resembles shadow boxing, which, as you know, CANNOT be defeated in principle.
Alas, virus writers are always one step ahead of virus defenders.
One hope is that our life-tested antivirus coped, copes and will cope with this scourge.
Пaвeл
07:34:45 2020-08-06
ka_s
06:48:28 2020-08-06